687 models · 4,192 model years · 740 fully rated · data through Oct 30, 2026
Which used car is cheapest to own?
Compare price, lost value, repairs and fuel for up to three cars, and see which one really costs you least.
Every car sold in the US since 2015, e.g. “Kia Telluride 2021”. Full ratings for 85 popular models so far.
- Free, no sign-up
- Based on 90,000+ owner reports
- Updated with NHTSA data
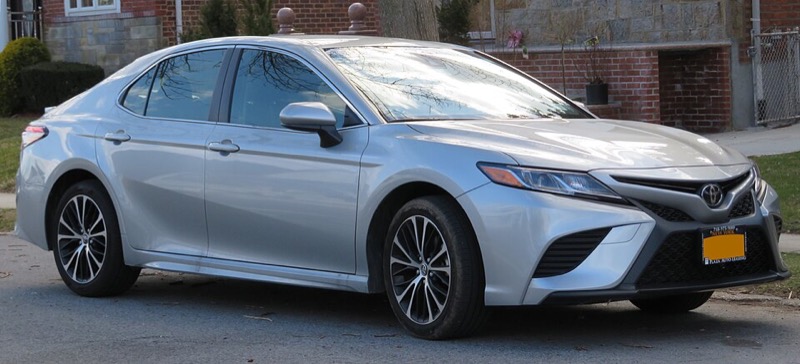
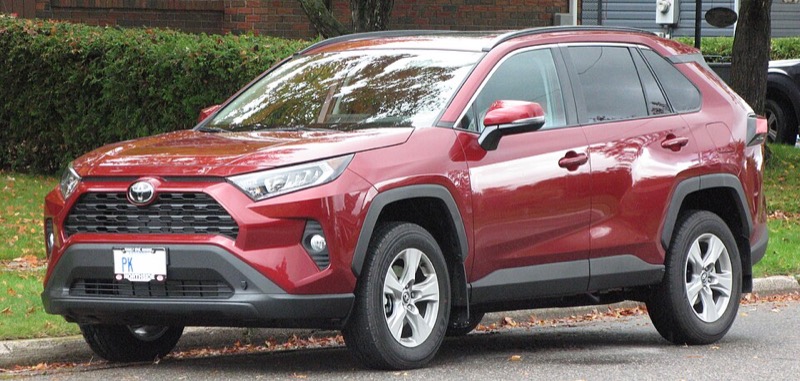
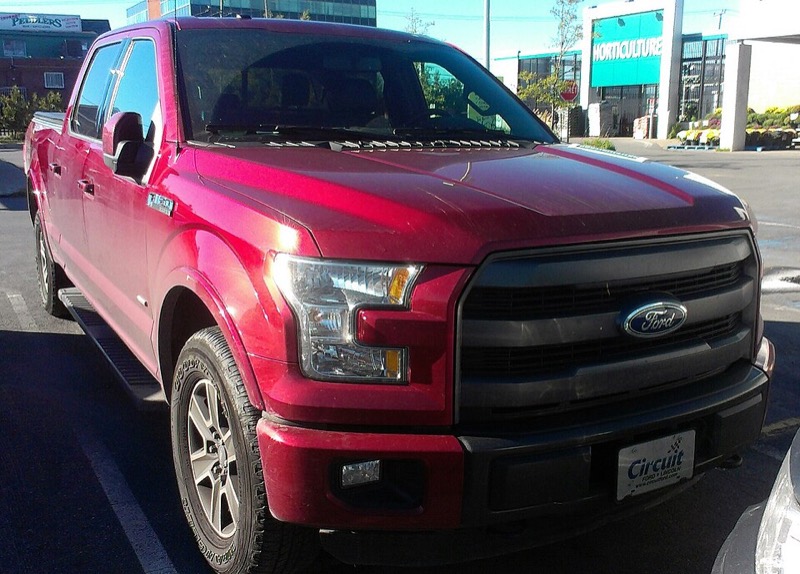
Browse by type
All rankings →Your cars
Search by name or paste a VIN from a listing
How you drive
Rough answers are fine
The answer
Updates as you change anything above
Loading the forecast…
Best & worst cars
The best and worst model years to buy used
Ranked by expected repair costs between ages 3 and 8, compared with similar cars. Tap Compare to add one to your list.
Estimated rankings. They divide NHTSA owner complaints by estimated sales, not licensed registration data, and models marked “early estimate” use our own sales ballpark. Treat them as a guide.
How it works
A forecast for the model year, not a guess about one car
-
We read owner reports
Every complaint owners file with NHTSA says what failed and when. We sort them into twelve repair areas, from engine to electrical.
-
We learn how problems build up
A model learns how repairs pile up with age for each model year. Years built on the same platform share data, so a year with few reports stays steady.
-
We price your years
We add up likely repairs for the years you'll own the car, skip anything still under factory warranty, and add fuel from EPA ratings.
Good to know
Is this a history report for a specific car?
No. It forecasts what a typical car of that make, model, year and engine will cost to keep. How a particular car was driven and maintained matters a lot, so always get a pre-purchase inspection and a vehicle history report.
What does the reliability score mean?
It compares a model year with similar cars (other midsize sedans, say) by expected repair costs between ages 3 and 8, the stretch most used cars are bought in. 100 is the best, 50 is typical and 0 is the worst.
How accurate are the dollar figures?
They're estimates. Ratings divide owner complaints by estimated sales (for models marked “early estimate”, our own ballpark, not licensed data). Owner complaints over-represent safety issues and well-publicised problems, and repair prices vary by region and shop. That's why we show a likely range, not just one number. Which car comes out cheaper is more reliable than any single dollar amount.
Where do the prices come from?
Prices are rough estimates: a typical original price for the model, adjusted for its model year and run through a standard depreciation curve. Mileage, trim, condition and where you live move real prices a lot, so use them to compare cars, not to negotiate. We'll switch to live market data from current listings soon.
Why isn't my car rated?
You can look up every car sold in the US since 2015 (over 600 models) and see its fuel cost, recalls and owner complaints. Full reliability ratings, repair forecasts and prices cover 19 popular sedans, SUVs and pickups so far. Rating a car needs its sales figures, to turn complaint counts into rates, and we're adding more models as we get them.
Where does the data come from?
NHTSA consumer complaints and recalls, NHTSA's VIN decoder and EPA FuelEconomy.gov, all public US government data. UsedCarWise isn't affiliated with any of them or with any manufacturer.